Pareto Analysis
Pareto graphs are often used for analysis. A generalized Pareto rule (or 80-20-rule) describes that 80% of the outcomes are caused by 20% of the causes.
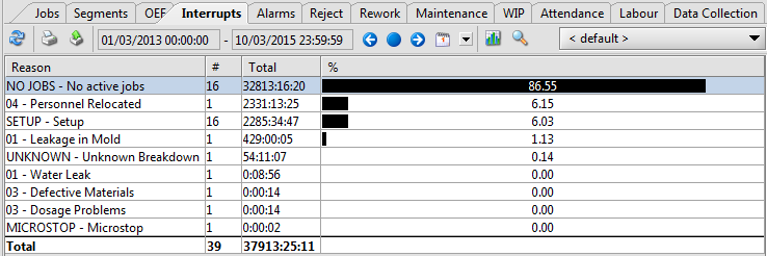
For example: 80% of the downtimes can be caused by 20% of the interrupt reasons.
The Pareto gives a visual representation of data in a horizontal bar graph. Objective allows for Pareto analyses based on various keys.
Objective MES offers practical Pareto analysis functions that allow zooming in on interrupts and jobs with the status HELD from different points of view, such as:
- Based on machines: See View the Pareto of interrupts subdivided by machine.
- Based on reasons: See View the Pareto of interrupts subdivided by interrupt reasons.
- Based on time: Do some interrupts occur more at given points in time (minute, hour, day, month, year)?